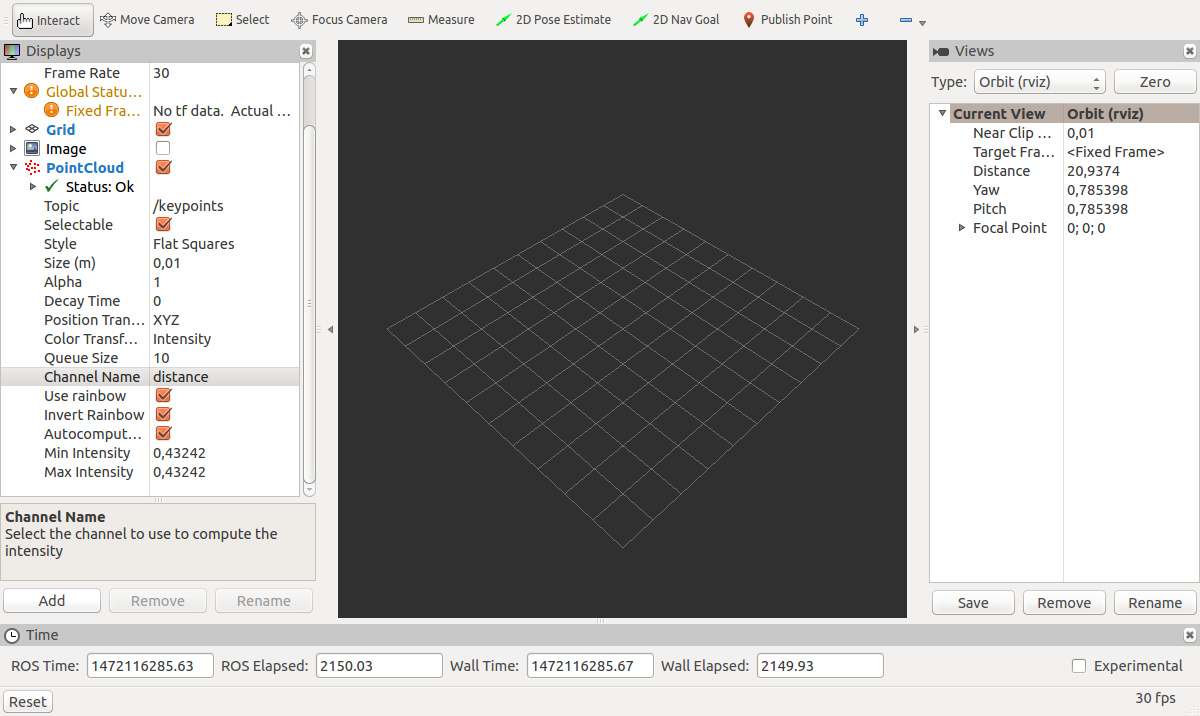
I try to build my own point cloud with a gaussian distribution. The visualization with rviz doesn't work.
Here is how I create the pointcloud
int sizeOfCloud = 1000;
keypoints.points.resize(sizeOfCloud);
getRandomPointCloud(keypoints, 100, 100, sizeOfCloud);

keypoints.header.frame_id = "base_link";
keypoints.header.stamp = ros::Time::now();
keypoints_publisher.publish(keypoints);
and here is the function getRandomPointCloud:
void getRandomPointCloud(sensor_msgs::PointCloud& pc, int centerX, int centerY, int& sizeOfCloud) {
    std::random_device rd;
    std::mt19937 gen(rd());
    std::normal_distribution<> distX(centerX, 10);
    std::normal_distribution<> distY(centerY, 10);


    for (int i = 0; i < pc.points.size(); i++) {
        double xValue = distX(gen);
        double yValue = distY(gen);
        std::cout << std::round(xValue) << std::endl;
        pc.points[i].x = std::round(xValue);
        pc.points[i].y = std::round(yValue);
    }
    std::cout << "done" << std::endl;
}
As I said, it can't be displayed in rviz. I do select by topic, select the proper topic and then there is nothing on the screen. Topic is correct and if I set the grid to base_link then everything with the topic is okay. Maybe I have to set a special attribute in rviz or I don't build my pointcloud correctly.
Edit: My Publisher:
ros::Publisher keypoints_publisher;
keypoints_publisher = nh.advertise<sensor_msgs::PointCloud>("/keypoints", 1000);
Edit2:
Here is a screenshot of rviz. Maybe this shows my problem better

Originally posted by JanB on ROS Answers with karma: 11 on 2016-08-24
Post score: 0
Original comments
Comment by Shay on 2016-08-24:
How is your keypoints_publisher defined?
Comment by JanB on 2016-08-24:
I've edited it in my question. Sorry for forgetting this piece of code.
Comment by Shay on 2016-08-25:
What is your fixed frame, the first line of Displays window.
Comment by JanB on 2016-08-25:
I've writen base_link in Fixed Frame