I've a 2D sensor which provides a range $r$ and a bearing $\phi$ to a landmark. In my 2D EKF-SLAM simulation, the sensor has the following specifications $$ \sigma_{r} = 0.01 \text{m} \ \ ,\sigma_{\phi} = 0.5 \ \text{deg} $$
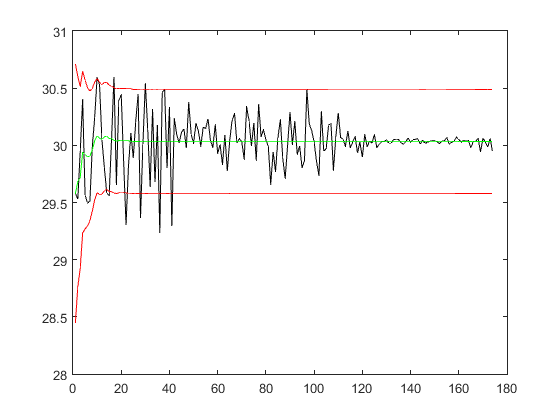
The location of the landmark in x-axis is 30. EKF imposes the Gaussian noise, therefore the location of the landmark is represented via two quantities namely the mean $\mu_{x}$ and the variance $\sigma_{x}$. In the following graph

The green is the mean $\mu_{x}$ which is very close to the true location (i.e. 30). The black is the measurements and red is $\mu_{x} \pm 3 \sigma_{x}$. I don't understand why the uncertainty is big while I'm using rather accurate sensor. The process noise for the robot's pose is $\sigma_{v} = 0.001$ which is small noise. I'm using C++.
Edit: for people who ask about the measurements, this is my code
$$ r = \sqrt{ (m_{j,y} - y)^{2} + (m_{j,x} - x)^{2}} + \mathcal{N}(0, \sigma_{r}^{2}) \\ \phi = \text{atan2} \left( \frac{m_{j,y} - y}{m_{j,x} - x} \right) + \mathcal{N}(0, \sigma_{\phi}^{2}) $$
std::vector<double> Robot::observe( const std::vector<Beacon>& map )
{
    std::vector<double> Zobs;

    for (unsigned int i(0); i < map.size(); ++i)
    {
        double range, bearing;

        range = sqrt( pow(map[i].getX() - x,2) +
                      pow(map[i].getY() - y,2)   );

        // add noise to range
        range += sigma_r*Normalized_Gaussain_Noise_Generator();

        bearing = atan2( map[i].getY() - y, map[i].getX() - x) - a;

        // add noise to bearing
        bearing += sigma_p*Normalized_Gaussain_Noise_Generator();

        bearing = this->wrapAngle(bearing);


        if ( range < 1000 ){
          // store measurements (range, angle) for each landmark.
          Zobs.push_back(range);
          Zobs.push_back(bearing);
          //std::cout << range << " " << bearing << std::endl;
        }
    }


    return Zobs;
}
where Normalized_Gaussain_Noise_Generator() is ( i.e. $\mathcal{N}(0, 1) )$
double Robot::Normalized_Gaussain_Noise_Generator()
{
    double noise;
    std::normal_distribution<double> distribution;
    noise = distribution(generator);

    return noise;
}
For the measurements (i.e. the black color), I'm using the inverse measurement function given the estimate of the robot's pose and the true measurement in polar coordinates to get the location of a landmark. The actual approach is as follows
$$ \bar{\mu}_{j,x} = \bar{\mu}_{x} + r \cos(\phi + \bar{\mu}_{\theta}) \\ \bar{\mu}_{j,y} = \bar{\mu}_{y} + r \sin(\phi + \bar{\mu}_{\theta}) $$
This is how it is stated in the Probabilistic Robotics book. This means that the measurements in the above graph are indeed the predicted measurements not the true ones.
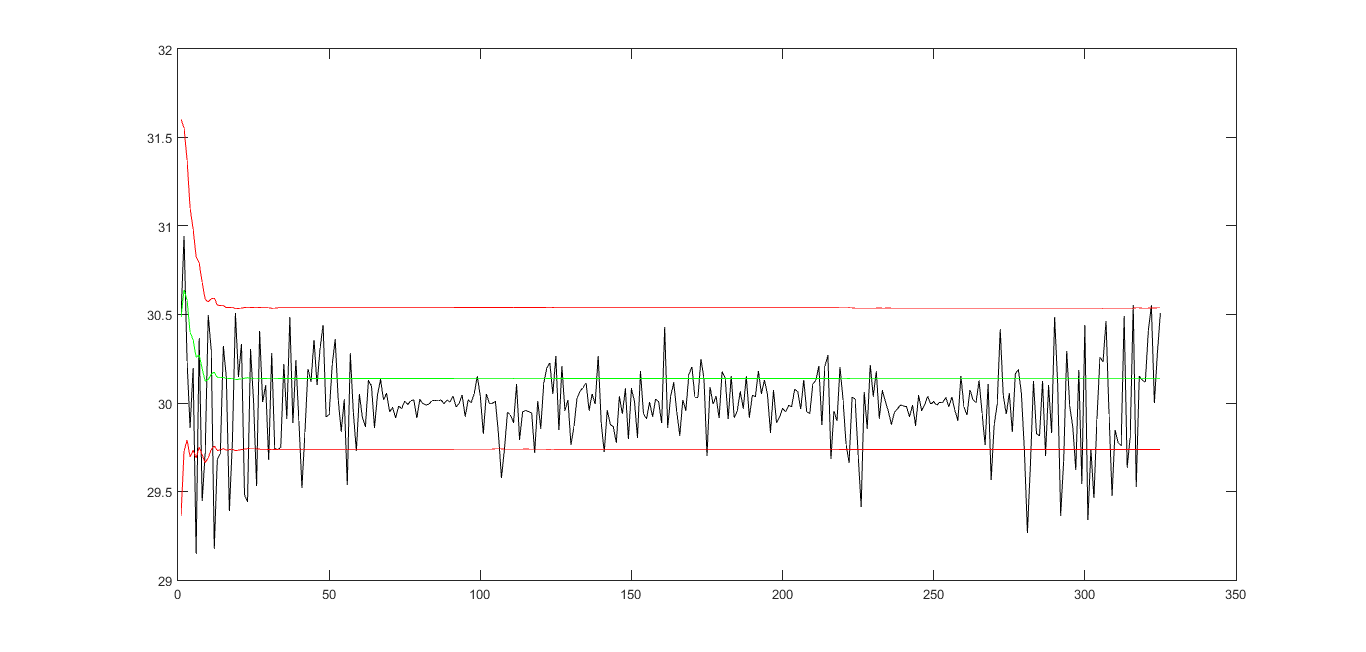
Now under same conditions, the true measurements can be obtained as follows
$$ \text{m}_{j,x} = x + r \cos(\phi + \theta) \\ \text{m}_{j,y} = y + r \sin(\phi + \theta) $$
The result is in the graph below, which means there is no correlations between the true measurements and the robot's estimate. This leads me to the same question - why the uncertainty behaves like that?
