0
$\begingroup$

I want to build simulation for S curve velocity profile (TIME-OPTIMAL POSITION PROFILE).

I want to use an S-curve for my velocity profile where the position is already given. This means I have to start the motion using acceleration (if possible, including all three phases of acceleration), followed by a constant velocity phase if possible, and then deceleration (if possible, including all three phases of deceleration).

By the end of these phases, the velocity should be zero and the position should reach the desired value.

Given the following values:

  • Position: 1000
  • Velocity: 2000
  • Acceleration: 200
  • Deceleration: 200
  • Jerk: 100

Since the velocity is greater than the position, it's not possible to reach the given velocity. Therefore, we need to recalculate the maximum velocity, peak acceleration, and peak deceleration.

Can you help me solve this? How do we recalculate or find the peak values for velocity, acceleration, and deceleration?

Note: I do not want to use time or do not want time dependency.

Here is a plot of the S-curve I have traced with my current equation with given values where the velocity becomes 0 but the position cannot reach 1000.
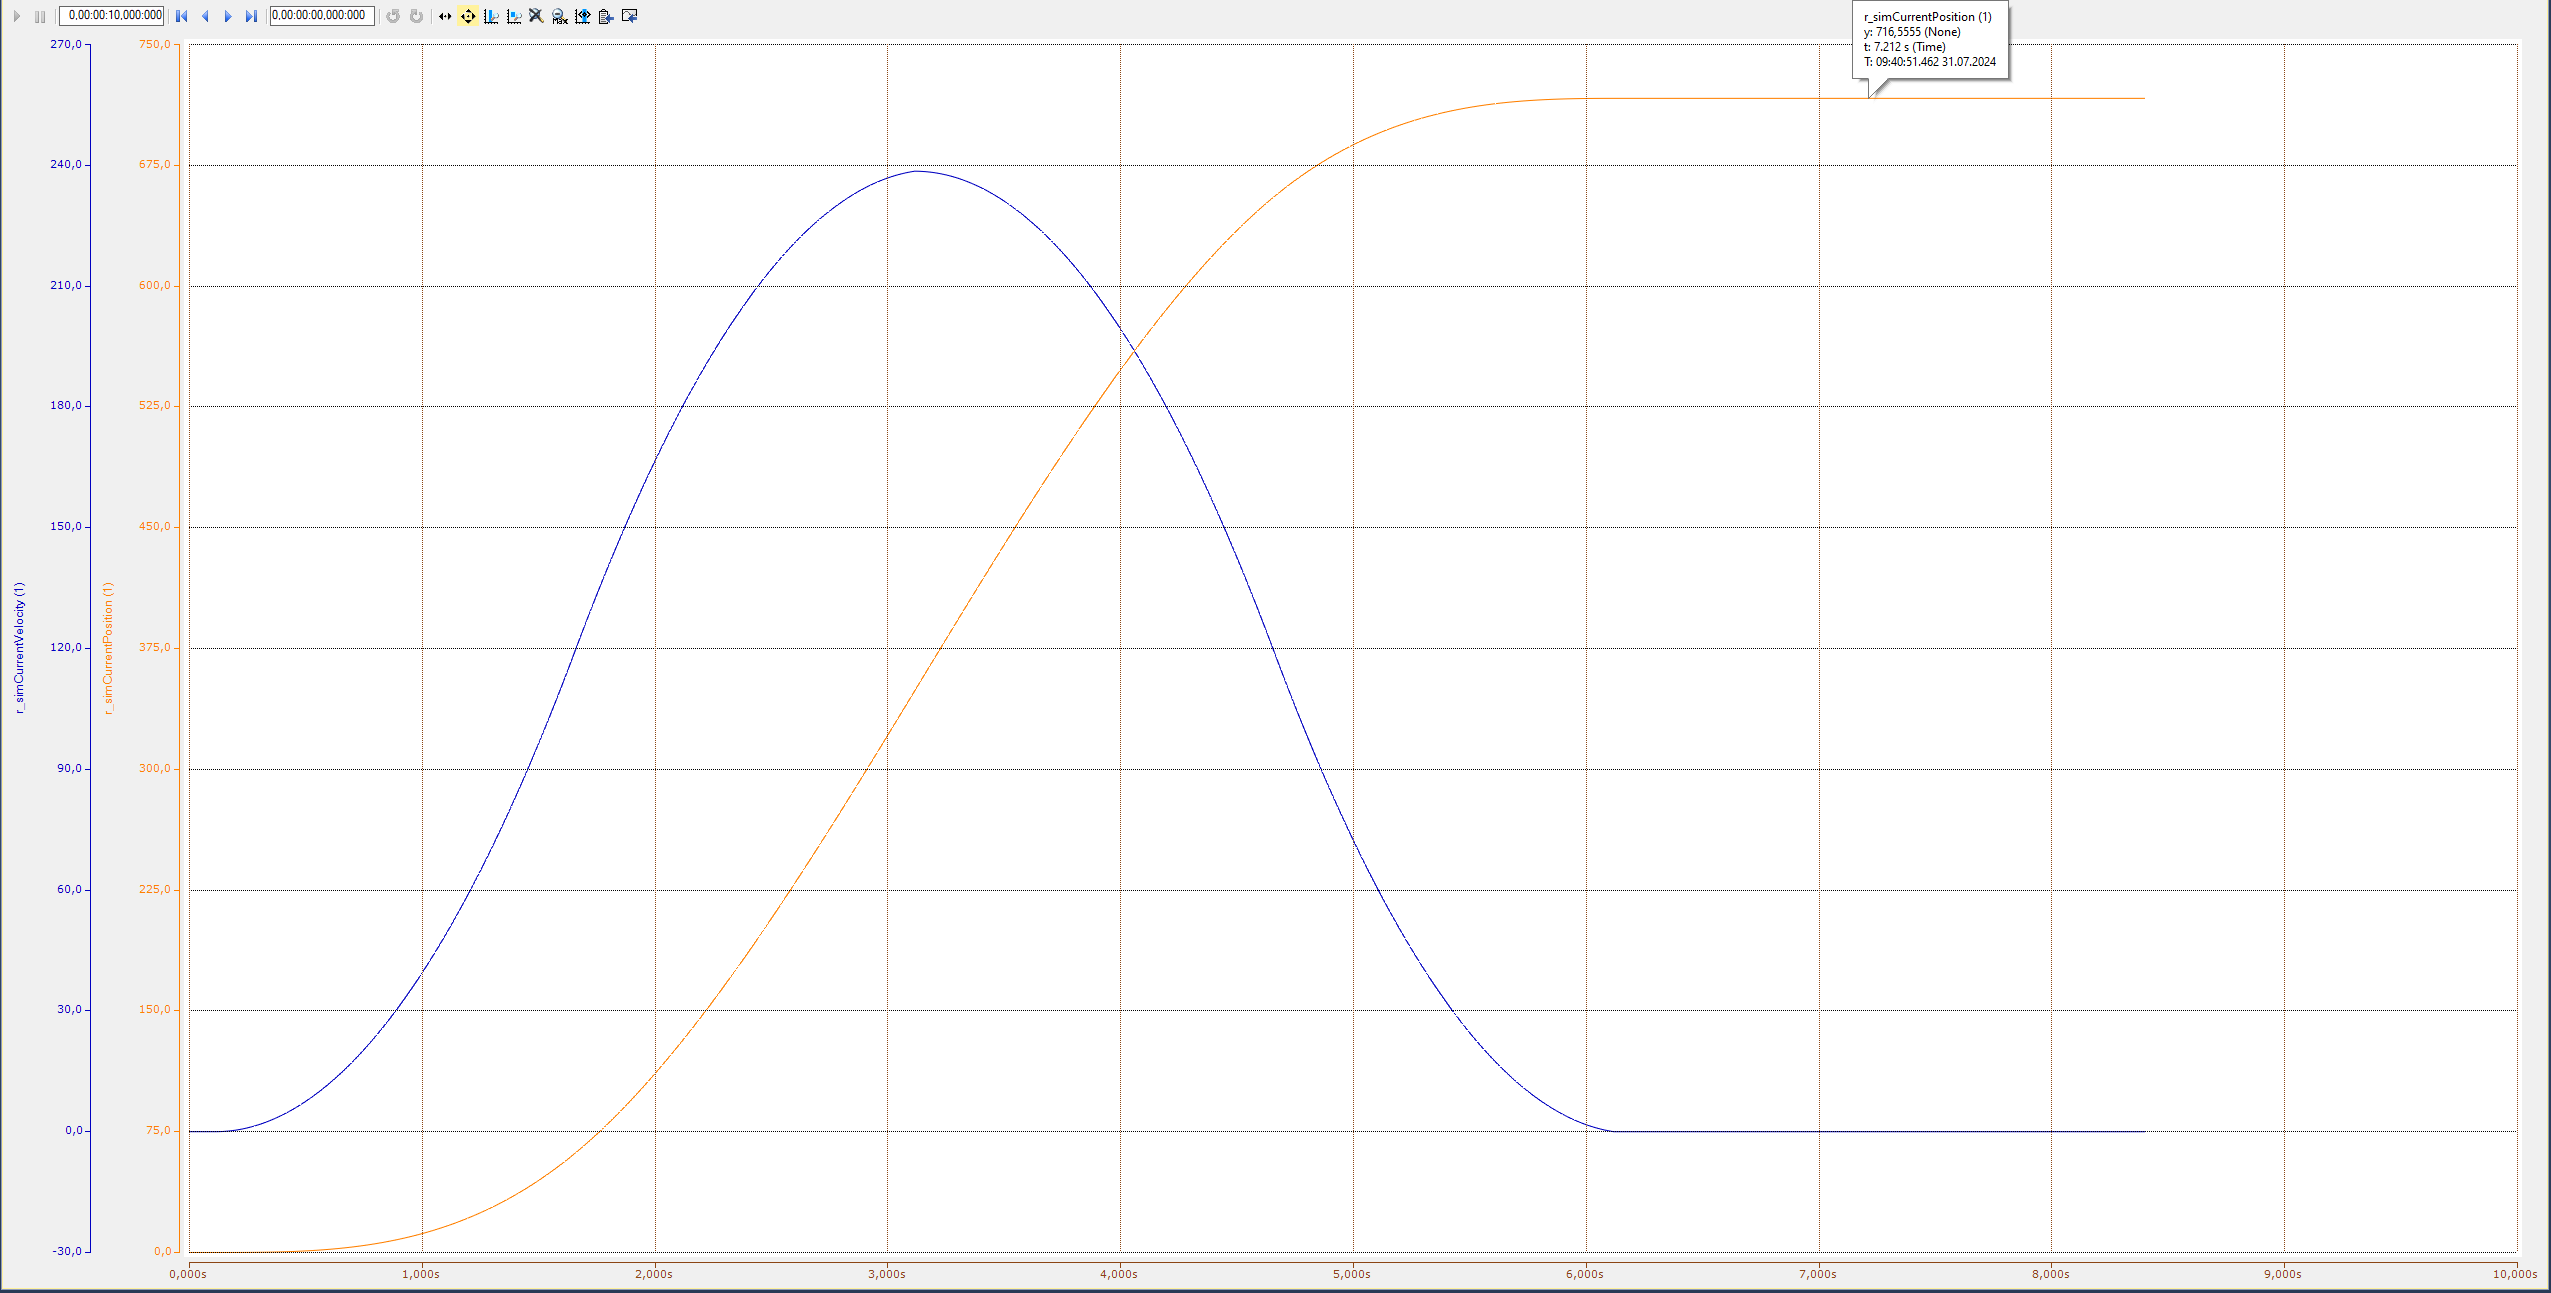
where the velocity becomes 0 but the position cannot reach 1000.
$\endgroup$
2
  • $\begingroup$ That velocity limit > target position is no indication that the peak velocity can't be reached. You can of course drive a car at 70mph to a destination 60 miles away. With enough acceleration/jerk, you can reach peak velocity in arbitrarily little time/distance. $\endgroup$ Commented Jul 30 at 17:13
  • $\begingroup$ @NuclearHoagie Thank you for your reply! Perhaps I was not able to explain my problem clearly. Can you please check the description again, I have attached a picture as well which might clarify the confusion related to my query. $\endgroup$
    – whiz
    Commented Jul 31 at 7:57

1 Answer 1

1
$\begingroup$

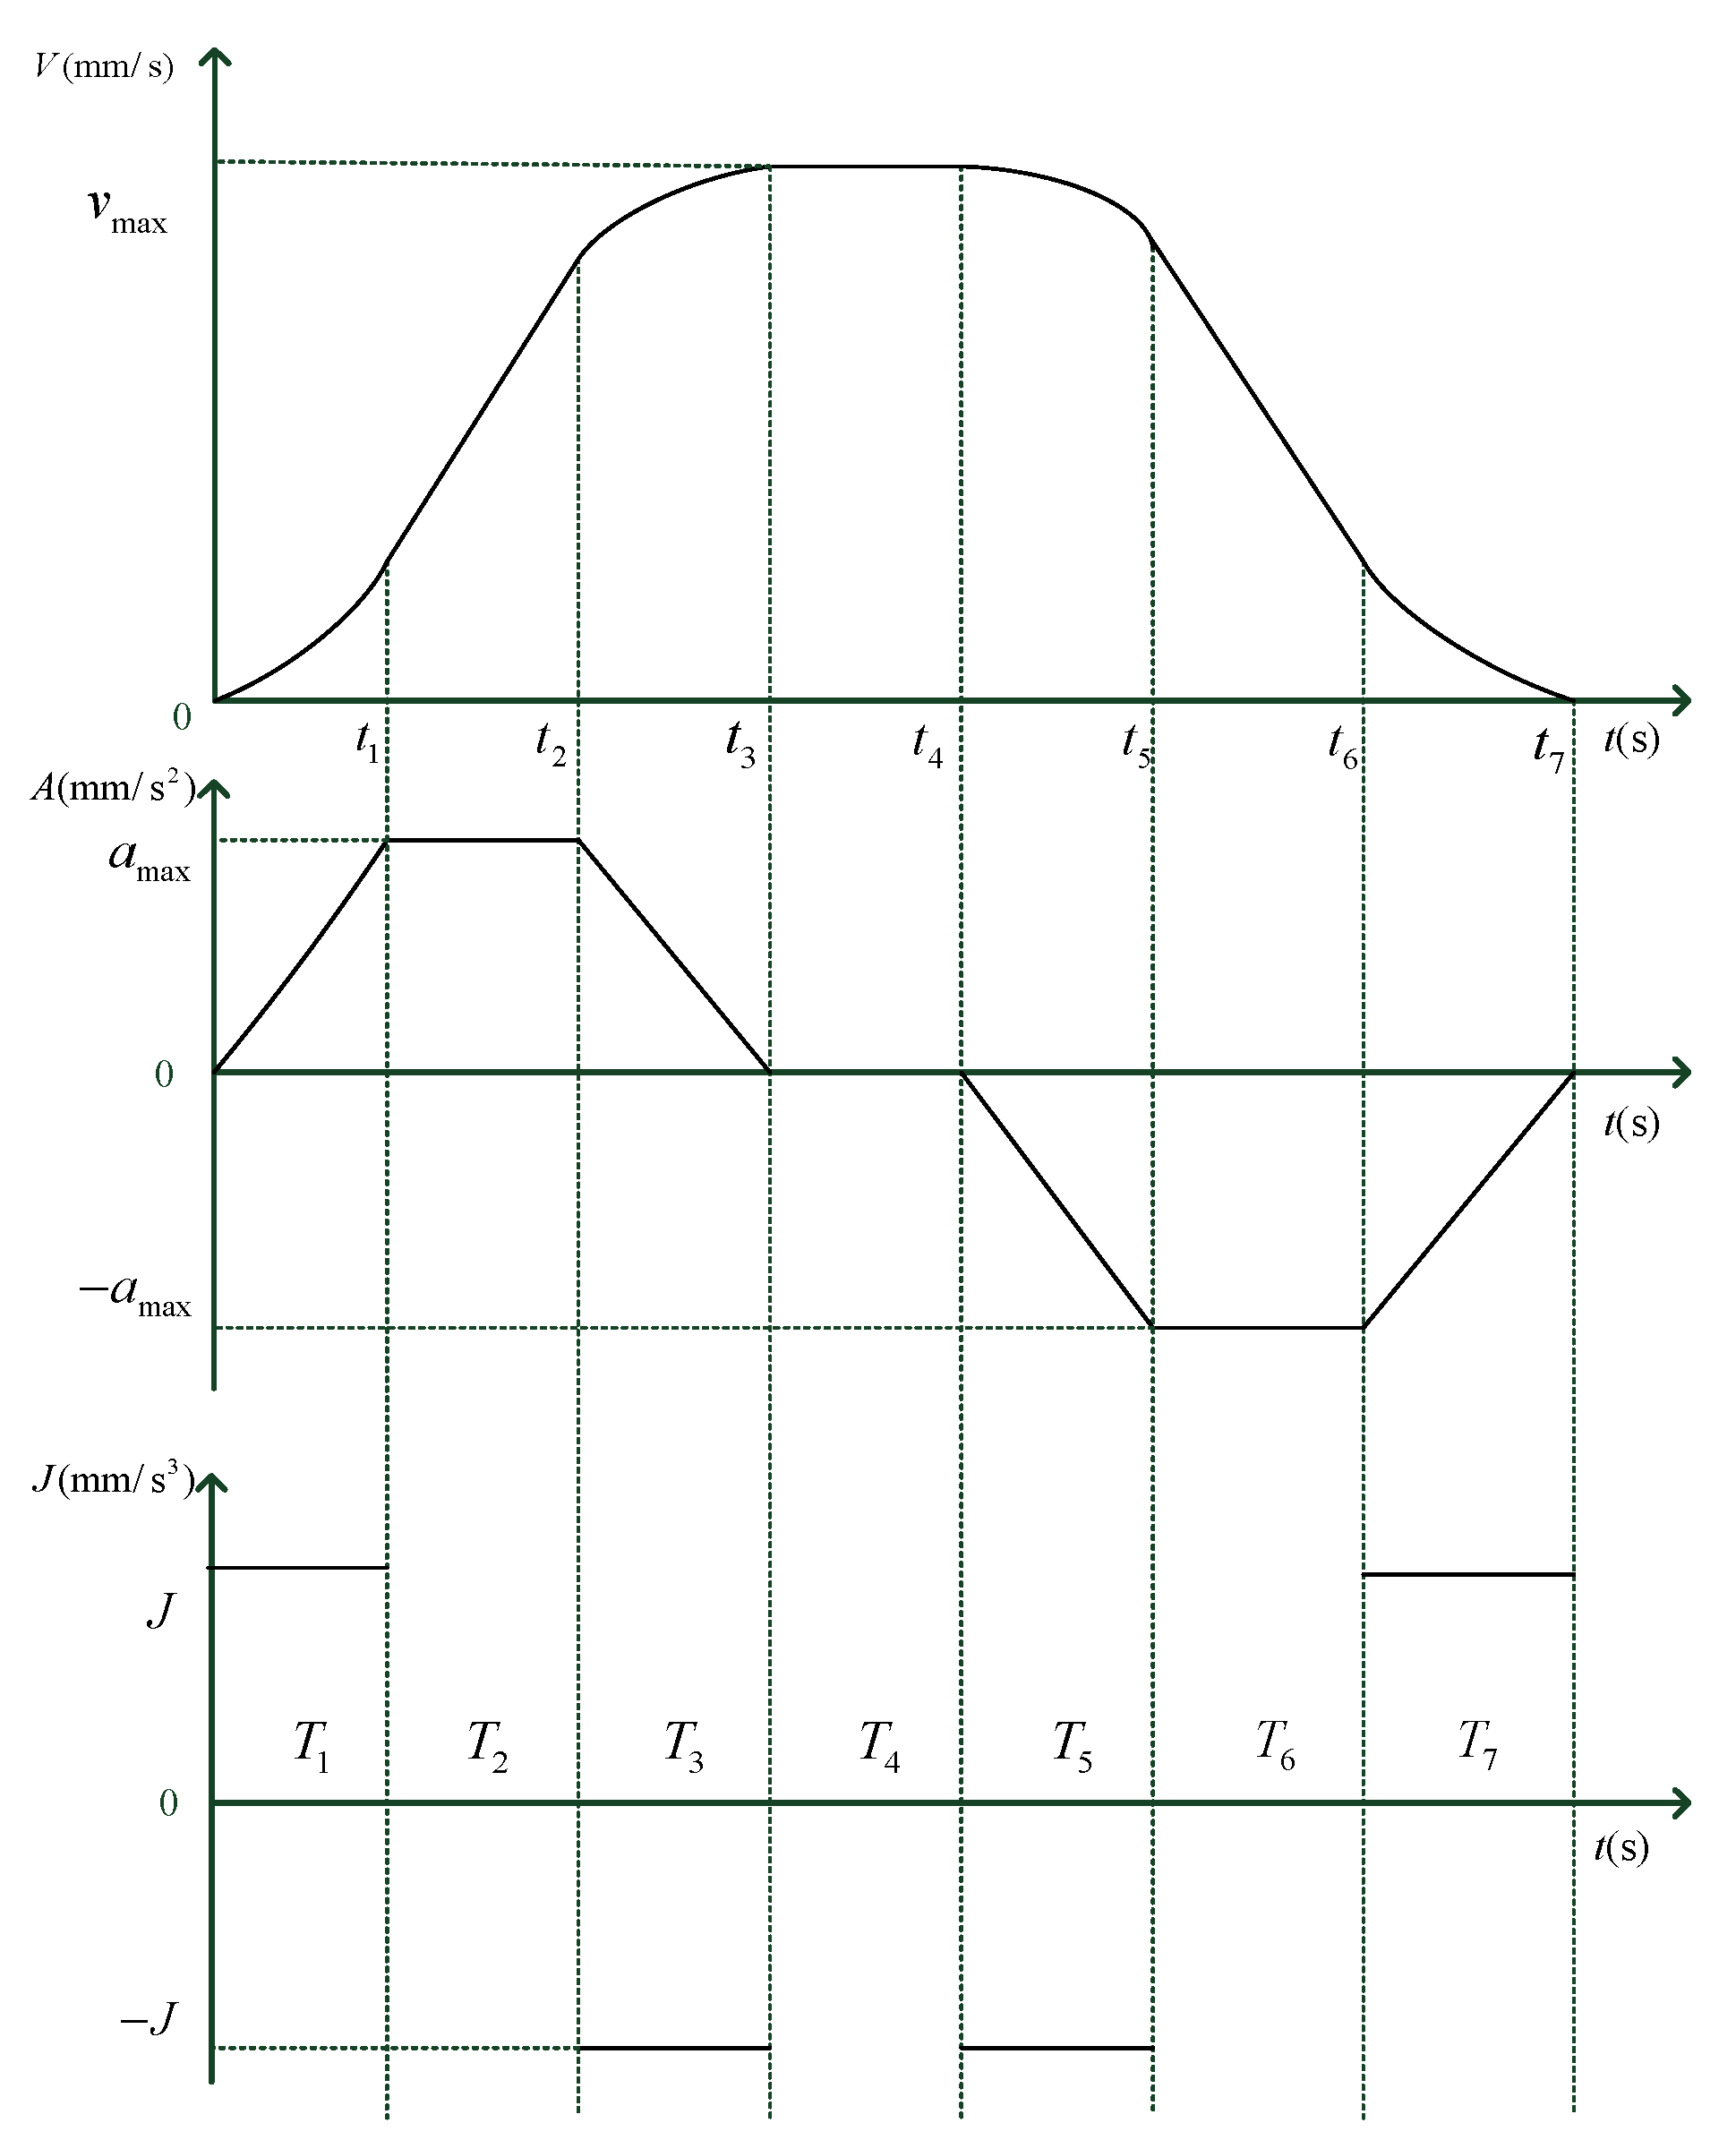
I think you can approach it from the graph of the s-velocity profile, where the position/distance traveled is the area under the velocity graph. Let's say we have a profile like this: source: Wang G, Xu F, Zhou K, Pang Z. S-Velocity Profile of Industrial Robot Based on NURBS Curve and Slerp Interpolation. Processes. 2022; 10(11):2195. https://doi.org/10.3390/pr10112195

The image is taken from paper:

Wang G, Xu F, Zhou K, Pang Z. S-Velocity Profile of Industrial Robot Based on NURBS Curve and Slerp Interpolation. Processes. 2022; 10(11):2195. https://doi.org/10.3390/pr10112195

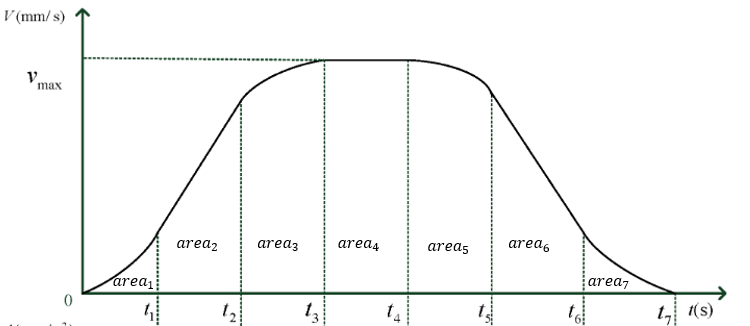
Segment the area to

enter image description here

Where the position/distance traveled is the sum of them: $$distance = area_1 + area_2 + area_3 + .... + area_7$$

We can also see from the graph that one half of the graph mirrors the other half. That cause: $$area_1 = area_7$$ $$area_2 = area_6$$ $$area_3 = area_5$$

You need to calculate this $area_x$ value according to your parameter. $$area_x = f(velocity,acceleration,jerk)$$

Let's take the easiest, for $area_4$: $$area_4 = v_{max} * (t_4 - t_3)$$

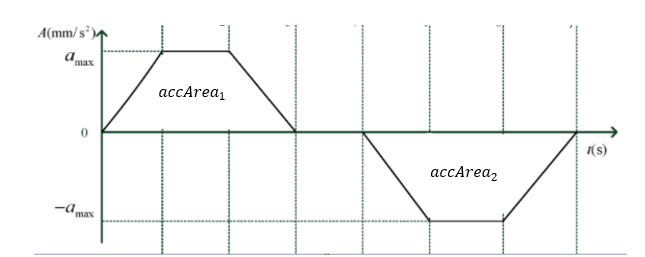
Where $$v_{max} = {accArea}_1 * (t_3) $$ enter image description here

To calculate this $accArea$ you can utilize jerk value again.

For another area, try to find them by yourself.

After you find all the formula, and put them to one equation $$distance = f(velocity,acceleration,jerk)$$

You can find each parameter for the distance traveled.

$\endgroup$
2
  • $\begingroup$ Thank you very much for your answer! Here we have to dependent on time for areas. Is there another method where time can be neglected (a time-optimal method)? $\endgroup$
    – whiz
    Commented Jul 31 at 10:01
  • $\begingroup$ I am not sure what you mean by time-optimal method. Intuitively, you can not ignore the time. As an example, you can't reach a high $v_{max}$ with small $acceleration$ in a very short time. $\endgroup$ Commented Jul 31 at 23:35

Your Answer

By clicking “Post Your Answer”, you agree to our terms of service and acknowledge you have read our privacy policy.

Not the answer you're looking for? Browse other questions tagged or ask your own question.